Statistics
Statistics - Detailed information about spam and good messages you have received.
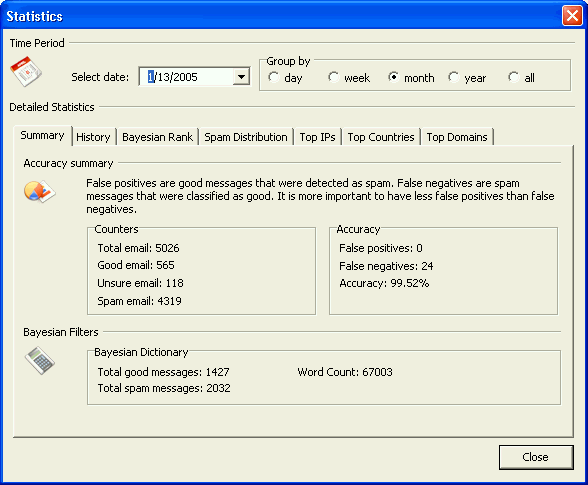
Summary - Provides basic information on the good and spam email messages you have received for the selected time period. The time period can be changed by using the date selector and time period radio buttons at the top of the form.
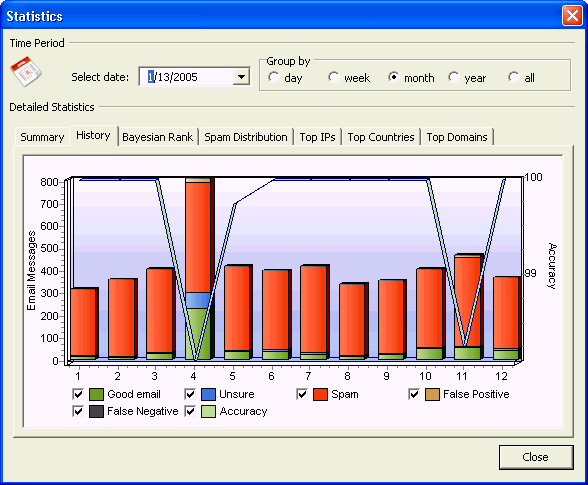
History - Provides a graph of the selected time period for good, spam and unsure email messages. Also included is accuracy information as well as the amount of false positives or negatives.
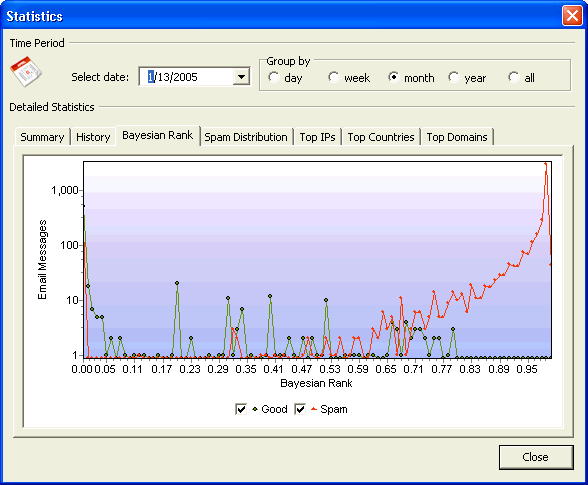
Bayesian Rank - Shows the distribution of messages as they are ranked by SpamBully. This is compiled by looking at the Bayesian rank of each message you have received for the given time period.
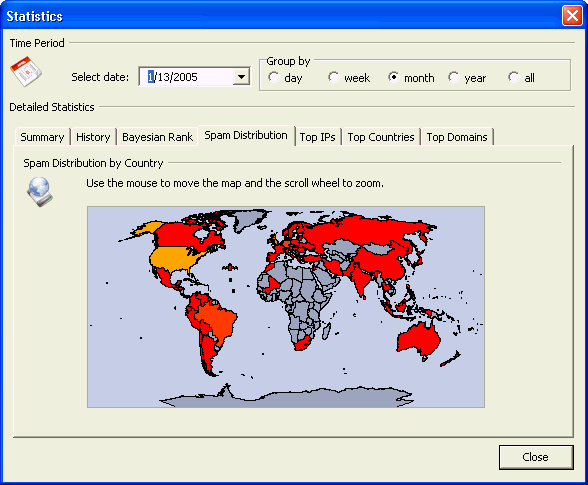
Spam Distribution - Shows the geographical distribution of spam messages for the given time period. The graph ranges from yellow to red. The more red a country appears the higher percentage of spam you have received from that country.
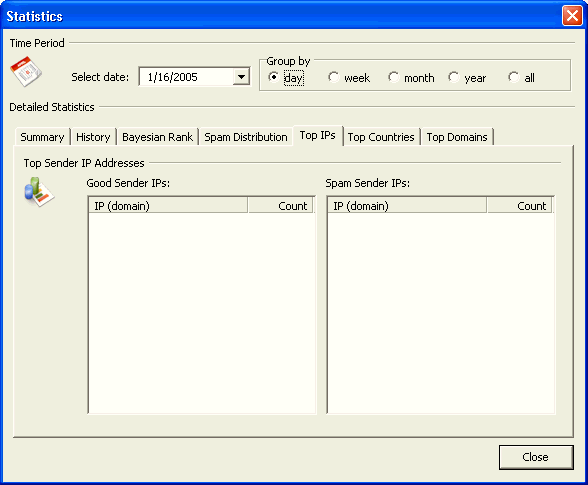
Top IP's - show the Top IP addresses for the servers sending you good or bad email for the given time period.
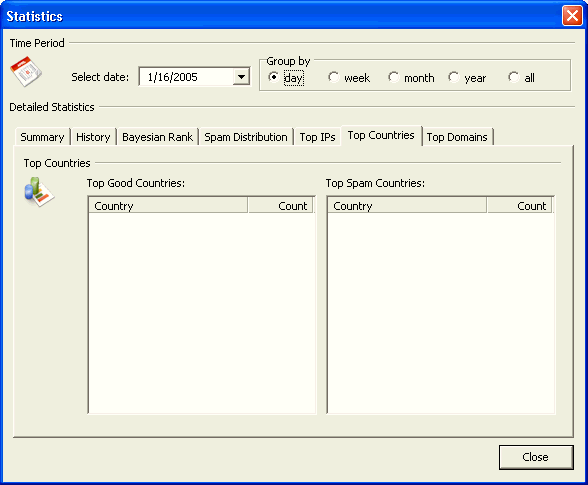
Top Countries - Shows the top countries for the servers sending you good or bad email for the given time period.
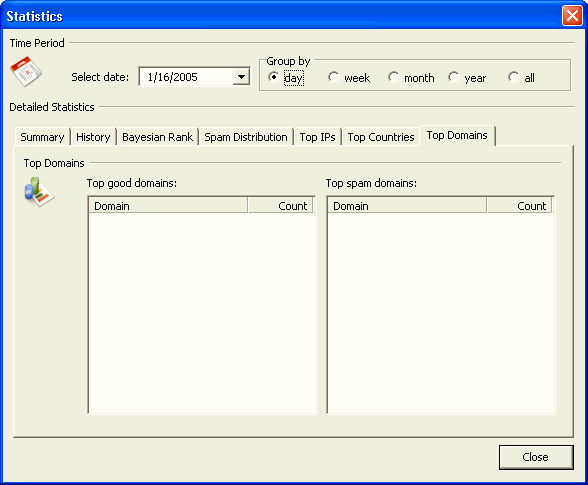
Top Domains - Shows the top domains for the servers sending you good or bad email for the given time period.
This article may
be found at:
http://www.spambully.com/sb3help/index.php?page=index_v2&id=101&c=4
| Article
Comments |
|
There are no user added comments for this article.
|
|


